Kubernetes 從零開始 - Informer 架構以及 Controller Pattern
Kubernetes Object
Kubernetes object 並不是指 Pod 或者是 Deployment 這種 Resource
複習一下,Resource 是所有你可以透過 Kubernetes 使用的物件(操作 kubectl 或Kubernetes API)
而 object 是這些 Resource 的 instance
有關 Resource 可以參考 Kubernetes 從零開始 - 高階抽象 Workload Resources | Shawn Hsu
Kubernetes Object State
所謂的狀態是儲存在 Object 裡面的
object 的 spec 以及 status 分別代表了 desired state 以及 current state
spec 的內容可以透過一個特殊的檔案指定(稱為 manifest, 格式為 json 或 yaml)
並透過操作 kubectl 或 Kubernetes API 來建立 object
其中 status 是由 Controller 更新的,不是由我們手動指定的
考慮建立一個 nginx pod
並且查看他的 yaml 檔案
你就會看到類似以下的東西,這就是 object 的 status
可以看到 pod status 從最初的 PodScheduled 一直到 PodReadyToStartContainers
同時你也可以得知內部 container 的狀態
Controller 會根據這些狀態來管理 object
1
2
3
4
5
6
7
8
9
10
11
12
13
14
15
16
17
18
19
20
21
22
23
24
25
26
27
28
29
30
31
32
33
34
35
36
$ kubectl run mynginx --image=nginx
$ kubectl get pods mynginx -o yaml
status:
  conditions:
  - lastProbeTime: null
    lastTransitionTime: "2024-10-25T14:14:04Z"
    status: "True"
    type: PodReadyToStartContainers
  - lastProbeTime: null
    lastTransitionTime: "2024-10-25T14:13:44Z"
    status: "True"
    type: Initialized
  - lastProbeTime: null
    lastTransitionTime: "2024-10-25T14:14:04Z"
    status: "True"
    type: Ready
  - lastProbeTime: null
    lastTransitionTime: "2024-10-25T14:14:04Z"
    status: "True"
    type: ContainersReady
  - lastProbeTime: null
    lastTransitionTime: "2024-10-25T14:13:44Z"
    status: "True"
    type: PodScheduled
  containerStatuses:
  - containerID: containerd://0ab6c6781723446e4869f1fd96b1d62b78a95dea327e45d276d010a5236f9ac8
    image: docker.io/library/nginx:latest
    imageID: docker.io/library/nginx@sha256:28402db69fec7c17e179ea87882667f1e054391138f77ffaf0c3eb388efc3ffb
    lastState: {}
    name: mynginx
    ready: true
    restartCount: 0
    started: true
    state:
      running:
        startedAt: "2024-10-25T14:14:04Z"
Imperative vs. Declarative
Imperative Management: 手把手教學,告訴 K8s 怎麼做Declarative Management: 告訴 K8s 我們想要什麼,K8s 會幫我們達成
Kubernetes 大多數的操作都是透過 declarative 的方式
比如說你指定 deployment replica 的數量就是告訴 desired state
然後 Kubernetes 就會幫你達成這個狀態
注意到很可能 cluster 永遠沒辦法達到你想要的狀態,但它會盡力達到
當然你也可以透過 imperative 的方式來操作,但是這樣的話,你就要自己手動管理狀態了
Introduction to Kubernetes Controller and State Management
在 Kubernetes 從零開始 - 無痛初探 K8s! | Shawn Hsu 中有提到
K8s 是透過 Controller 管理 cluster 狀態的
我們告訴 K8s 我們想要的狀態,然後 K8s 會幫我們達成這個狀態(i.e. Declaration Management)
Controller 並不會直接操作 pod,而是透過 Kubernetes API Server 來管理 cluster 狀態
比如說,建立或刪除 pod,甚至是更新 object 的狀態(e.g. Finished)
不會直接操作 pod 但透過 API Server 建立/刪除?
舉例來說如果 replica 5 的 deployment 少了一個,那麼的確是要建立一個新的對吧?
間接的操作 pod ,是這個意思
Controller Pattern

以上架構圖就是官方給的 Controller 的架構
具體來說,Reflector 會監聽 object 的變化
將 event 放到 delta-FIFO queue 裡面
並透過 Informer 處理這些 event,將 object 儲存到 thread-safe store 裡面
並且同時將 object 的 key dispatch 到 workqueue 裡面
然後你的 Custom Controller 從 workqueue 裡面拿到 reference 並使用 Lister 來取得完整的 object 資訊(查詢 thread-safe store)
為了一次只處理固定數量的 work,所有 component 之間的溝通都是透過 workqueue 來做的
有了 queue 擋在中間,可以保證同一個 item 不會同時被多個 Controller 處理
有關 queue 的討論,可以參考 資料庫 - 從 Apache Kafka 認識 Message Queue | Shawn Hsu
Reflector
Reflector 會聽 object 的變化並將變化的 object 放到 delta-FIFO queue 裡面
問題來了 他要怎麼聽這些所謂的變化呢?
Kubernetes API Server 提供了一個方式讓你監聽特定的 object,稱為 Watch
每個 Kubernetes Object 都會有一個 resourceVersion 的欄位,你可以把它想像成是一個 unique 的 ID
這個 ID 是對應到底層的 storage 的識別符號,這個 ID 會隨著 object 的變化而變化 所以不是固定值
Watch 會持續監聽,List 則不會
你可以用這個 ID 來監聽 object 的變化
有點類似 linked list 的概念,你只要知道開頭,就可以知道後續的資料位置
所以監聽的概念也是一樣的,只要知道某個 object 目前的 resourceVersion,你就可以知道後續的位置,進而監聽它
Example
啟動一個 proxy 到 Kubernetes API Server
1
$ kubectl proxy --port 8888
port 可以隨意指定
取得目前的 resourceVersion
1
2
$ curl http://localhost:8888/api/v1/namespaces/default/pods | grep resourceVersion
"resourceVersion": "135966"
然後你就可以持續監聽後續 object 的變化(RV 135966 以後的資料)
1
$ curl http://localhost:8888/api/v1/namespaces/default/pods\?watch=1\&resourceVersion=135966
curl 使用的時候記得跳脫特殊字元
為了可以觀察到變化,你可以嘗試建幾個 pod 玩一下好方便觀察
1
$ kubectl run mynginx --image=nginx
所有的監聽歷史資料都是儲存在 etcd 裡面
想當然空間不會是無限的,預設只會保留 5 分鐘的資料
List and Watch
根據 KEP 3157
kube-apiserver 是非常脆弱的,它很容易受到記憶體壓力的影響導致服務中斷
而這股記憶體壓力來自於所謂的 LIST request(也就是 Reflector 之前的行為)
你不需要很多的 LIST request 就可以讓 kube-apiserver 過載(大概 16 個 LIST request 足以)
而它會間接導致整個 node 裡面的服務都中斷,包含 kubelet
他們發現,LIST request 的作法需要從 etcd 裡面拿到資料
並經過一系列的處理才能送回給 client(包含 unmarshal, convert, prepare response)
記憶體的用量是無法預估的(因為會受到 page size, filter 等等的影響)
而這些記憶體連 Golang 本身的 GC 都無法處理
為了要讓記憶體的用量變得可控
於是提出了使用 streaming 的方式,從 $O(watchers \times pageSize \times objectSize \times 5)$ 降到 $O(watchers \times constant)$
並且為了減少 etcd 的壓力,資料來源會從 Watch Cache 拿
只有在必要的時候與 etcd 同步資料
注意到 LIST request 並沒有要移除
所以改進的方法就明顯了
從 Watch Cache 拿資料,但一樣用 LIST request 嗎?
但如果繼續用 List Request,問題並不會解決,記憶體的問題只會從 etcd 轉移到 Watch Cache 而已
所以是用 WATCH request 搭配上 streaming 的方式來處理(模擬 LIST request 的行為)
所以你可以看到,reflector 的部分預設是用 streaming
然後有一個 fallback 的機制
1
2
3
4
5
6
7
8
9
10
11
12
13
14
15
16
17
18
19
20
21
22
23
24
25
26
27
28
29
30
31
32
33
34
35
36
37
38
39
40
// ListAndWatchWithContext first lists all items and get the resource version at the moment of call,
// and then use the resource version to watch.
// It returns error if ListAndWatchWithContext didn't even try to initialize watch.
func (r *Reflector) ListAndWatchWithContext(ctx context.Context) error {
    logger := klog.FromContext(ctx)
    logger.V(3).Info("Listing and watching", "type", r.typeDescription, "reflector", r.name)
    var err error
    var w watch.Interface
    fallbackToList := !r.useWatchList

    defer func() {
        if w != nil {
            w.Stop()
        }
    }()

    if r.useWatchList {
        w, err = r.watchList(ctx)
        if w == nil && err == nil {
            // stopCh was closed
            return nil
        }
        if err != nil {
            logger.Error(err, "The watchlist request ended with an error, falling back to the standard LIST/WATCH semantics because making progress is better than deadlocking")
            fallbackToList = true
            // ensure that we won't accidentally pass some garbage down the watch.
            w = nil
        }
    }

    if fallbackToList {
        err = r.list(ctx)
        if err != nil {
            return err
        }
    }

    logger.V(2).Info("Caches populated", "type", r.typeDescription, "reflector", r.name)
    return r.watchWithResync(ctx, w)
}
為了模擬 LIST request 的行為,WATCH request 會使用所謂的 BOOKMARK event
bookmark event 是一種特殊的 event,他用來表示目前的資料版本已經跟你提供的 resourceVersion(RV) 一致
在 watchList 裡面扮演著重要的角色
還記得我們說用 WATCH request 模擬 LIST request 的行為嗎?
主要的流程還是沒變,我需要先拿到歷史資料,拿完之後再繼續監聽新資料
當你接收到 bookmark event 的時候,表示所有歷史資料已經拿完了(最新的 RV 可以從 etcd 拿到,確保是 up-to-date 的),你的 Watch Cache 已經完全跟上了
最後,因為我們是使用 WATCH request,所以後續的 event 就會是新資料
沒有新的 API call
Resync
在 ListAndWatchWithContext 中,你會發現 Watch 不單只是 watch,還有 Resync 的機制
1
return r.watchWithResync(ctx, w)
我百思不得其解 Resync 的意義在哪
是為了處理斷線資料遺失的問題嗎? WATCH request 可以從上次的斷點繼續拉資料(i.e. RV) 所以不是
回答這題之前,要先了解 edge-based 與 level-based 的差異
edge-based: 專注於 “事件發生” 本身level-based: 專注於 “狀態” 本身
What does edge-based and level-based mean? 留言的例子滿精準的
如果你想要知道有多少的 Pod 是 READY 狀態
edge-based的做法會是當 Pod 變成 READY 的時候計算一次level-based則是從etcd拿到所有的 Pod 資料,然後計算一次
edge-based 的缺點在於如果你漏掉一兩個事件,那結果會不正確
level-based 則是你不知道哪時候所有的 Pod 會完成,所以你可能會需要處理很多次,比如說 10 秒檢查一次之類的
對回去 Controller Pattern 的實作,其實你會發現他是 edge-based 也是 level-based 的
edge-based 我們已經看過 WATCH request 如何避免網路中斷等等事故的應對方法
而 level-based 的方法就是 Controller 負責 Reconciliation,將 current state 往 desired state 推進(可參考 Control Loop)
但終究是人寫的,Controller 可能有疏漏,導致 state 處理不妥當導致失敗
那 level-based 的處理方法就是我再重新執行一次 Reconciliation
Controller 本身理論上要是 idempotent 的,所以沒問題
The resync period does more to compensate for problems in the controller code than to compensate for missed watch event. We have had very few “I missed an event bug” (I can think of one in recent memory), but we have had many controllers which use the resync as a big “try again” button.
ref: What’s the right resync period value for informers? By David Eads
重新執行並不是 Controller 內部重新 enqueue 那種,我們說的是你寫錯的那種
Resync 迫使你重新對 Resource 進行 Reconciliation
將 thread-safe store 的資料重新塞入 delta-FIFO queue 裡面,允許失敗的事件能有再一次處理的機會
注意到
Resync並不會重新拉所有的資料,只有 thread-safe store 內部的資料
Informer
Informer 本質上在做的事情是包含 Reflector 的功能(應該說 Reflector 是一個 tool 然後 Informer 才是真正使用的)
當接收到 event 的時候(從 delta-FIFO queue 拿),處理完 dispatch 到 workqueue 裡面
並且交給 Controller 進行處理
Indexer
從 Informer 傳遞給 Custom Controller 的資料只是單純的 object key
你大概猜得到為什麼不丟整個 object,多半是因為效能問題
寫入的部份是透過 Indexer 來做的
但只有 key 是不足以做 Reconciliation 的(因為資訊不足嘛)
Indexer 的作用就像是資料庫的 Index 一樣,可以快速的找到 object
所有相關的資料都是儲存在 thread-safe 的 store 裡面
存取的部份是透過 Lister(cache/lister) 實現的
所以這邊算是一個隱藏的 component
Control Loop

具體來說,Controller 是怎麼做 狀態管理 的呢?
前面提到 Kubernetes Object 裡面有存 desired state 以及 current state
所以 Controller 就會不斷的監控 object 的狀態,並且根據 desired state 來更新 current state
要做到不斷的監控,最簡單的方式就是一個迴圈,稱為 control loop
這種不斷監控並更新狀態的方式,就是所謂的 Reconciliation
理論上每個 Controller 都是獨立的 process, 但是為了方便管理,K8s 會將他們打包在一起
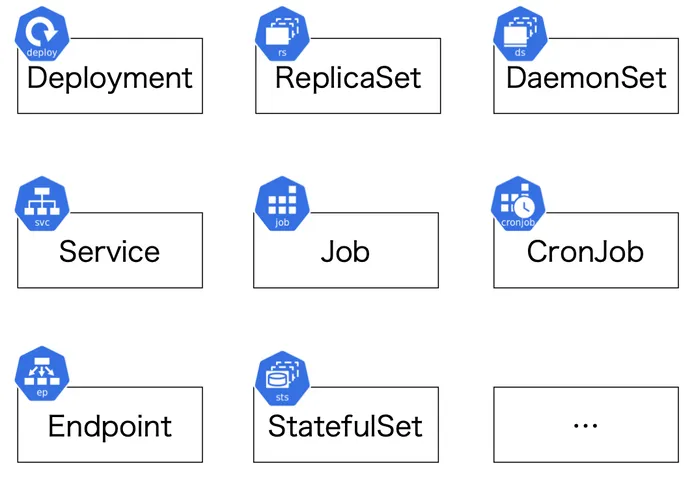
Controller Types
K8s 裡面,controller 其實不只有一種
針對不同的 Resource,K8s 會有不同的內建的 Controller
deployment 有自己的 Deployment Controller,job 也有自己的 Job Controller 等等的
有關 Resource 可以參考 Kubernetes 從零開始 - 高階抽象 Workload Resources | Shawn Hsu
Controller Conflict on Objects?
內建的 Controller 會監控特定的 object
但是有一些 Controller 他們看的 object 是同一種的
比如說 deployment 跟 job 都會監控 pod
會不會有一種可能他們的 Controller 會互相衝突呢?
事實上不會,Controller 會根據 object 的 label 來區分
References
- Difference between Kubernetes Objects and Resources
- Objects, Resources and Controllers in Kubernetes
- Objects In Kubernetes
- Kubernetes Object Management
- Kubernetes Controller 机制详解(一)
- What k8s bookmark solves?
- Watch bookmarks
- KEP 3157
- [提问]Informer 中为什么需要引入 Resync 机制?
- Informer, Cache and Queue | Kubernetes Informers vs Watch | Basics of client-go Kubernetes Part - 4
- kubernetes infomer 中的 resync
- 深入源码分析kubernetes informer机制(三)Resync
- What’s the right resync period value for informers?
- What does edge-based and level-based mean?
- What’s the right resync period value for informers?
Leave a comment